ENEnglish
 LTLietuviškai
 DEDeutsch
 FRFrançais
 RUРусский
 ESEspañol
 PLPolski
 ITItaliano
 UKУкраїнська
 CSČeština
 PTPortuguês
 JA日本語
 LVLatviešu valoda
 ETEesti
 HUMagyar
 IDBahasa Indonesia
 TRTürkçe
 HIहिन्दी
 ELΕλληνικά
 ARالعربية
 THไทย
 VITiếng Việt
 RORomână
 MSBahasa Melayu
 BNবাংলা
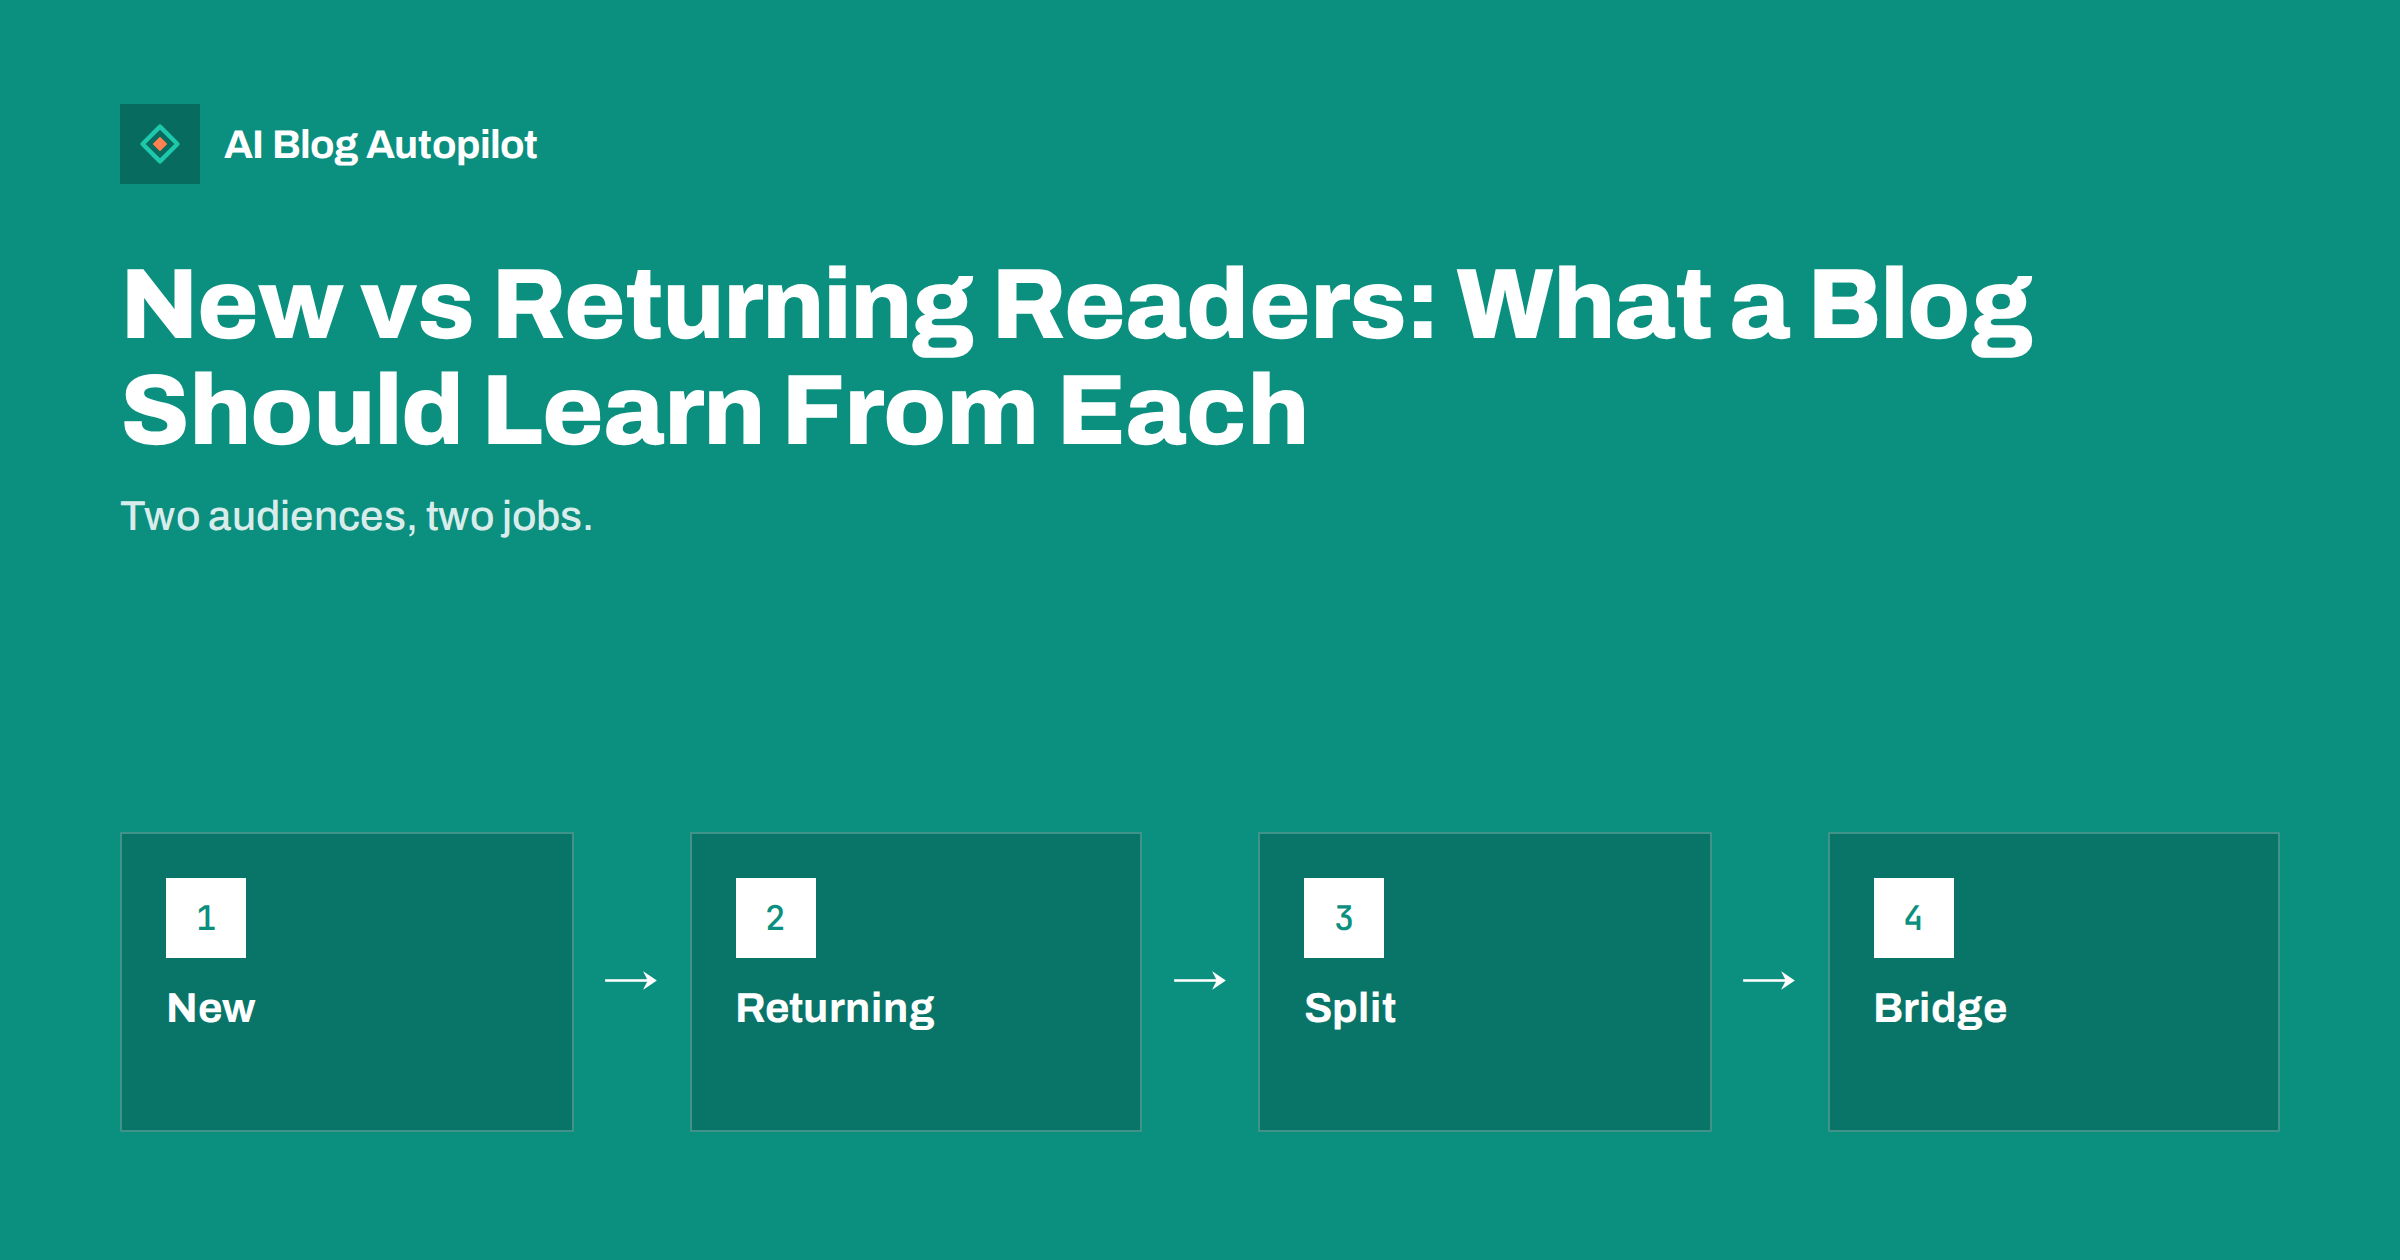
Short answer: new readers need to find answers, understand who you are and trust you quickly, while returning readers want depth, fresh material and a clear next step. Look at the split in your analytics by page, write some articles for each group and use simple bridges, such as related links and a newsletter, to turn first visits into habits.
Most analytics tools divide visitors into new and returning, but few bloggers use the split. They look at the total and miss that two very different groups are reading. A page that attracts many new readers may need a different job from one that mostly serves people who already know you.
This guide explains how to read the numbers carefully, what each group usually wants and how to adjust your articles and pages to serve both. The advice suits business blogs of any size, with the caveat that small numbers need patience.
Because the labels are imperfect, give them a sanity check. Ask a few regular readers whether they use more than one device, and look at how your numbers behave around events such as a newsletter, where you would expect a rise in returning visits. If the pattern makes sense, the data is probably usable. If not, treat it with more caution.
What the split really measures
Analytics tools usually classify a visitor as new if they have not visited before on that browser, and as returning if they have. This is an approximation. People use several devices, clear their cookies, block tracking or browse privately, so the same person may be counted as new many times.
Consent settings also matter. Where visitors decline analytics cookies, they may not be counted at all, or may be counted in a different way. The numbers are therefore best used as a rough guide to direction, not as a precise count of people. Compare periods using the same settings, and avoid reading too much into small changes.
Keep in mind the difference between visits and visitors. A returning visitor may account for many visits. Check which measure your report shows, so you do not mix them up. The guide to why Search Console and Analytics numbers never match shows how differently tools count.
Check the first screen on a phone. Many newcomers arrive on mobile, and if the headline is covered by a banner, a cookie notice or a large image, they may leave before reading a word. Keep the top of the page clean, and put the answer where the reader can see it without scrolling. Test with a real phone, not just a browser window resized on a computer.
Add a one-sentence description of your blog near the top of key pages or in the sidebar, such as who you write for and what you cover. Newcomers need to know whether they are in the right place, and a short line answers that question before they have to ask.
What new readers want
New readers usually arrive from a search engine, a social post or a link, with a specific question. They do not know you, and they decide in seconds whether the page is worth reading. They want a clear answer near the top, a page that loads quickly on a phone and signs that the source is trustworthy.
Serve them with a strong opening, a plain headline and a clear structure. Show who wrote the article and why they know the subject. Link to your about page and to related guides, so that a reader who likes the answer can learn more. Avoid assuming they know your terms or products.
Do not push too hard on the first visit. A request to buy or to sign up for a long form may scare away someone who is still learning. Offer a gentle next step: a related guide, a short checklist or a simple way to follow you. The guide to calls to action that fit a blog post explains how to match the request to the reader.
Consider a short series or a regular feature that gives people a reason to come back on a schedule, such as a monthly round-up of questions or a seasonal guide updated each year. Loyal readers like predictability, and a feature with a recognisable name becomes something they look forward to.
Ask them directly. A short survey or a single question in an email, such as what would you like us to cover next, tells you more than analytics ever can. Returning readers are usually glad to be asked, and their answers fill your topic list with ideas that you know have an audience.
What returning readers want
Returning readers have already decided you are useful. They come back for more depth, for news, for a new article or for help with a decision. Some are customers checking details, some are subscribers following a series and some are researchers comparing you with others.
Give them material that rewards loyalty: deeper guides, updated articles, comparison pages, case studies and practical tools. Make new content easy to find with a clear blog listing, a visible latest-posts area and a simple way to subscribe. Help them avoid repeated content, so they do not feel they have read it all before.
Returning readers are also the most likely to act. They ask for quotes, book appointments and buy products. Make sure that your contact, pricing and booking pages are easy to reach from your articles, and that the next step is clear and honest.
Create a simple table with three columns: the page, the share of new readers and the main action taken. Update it every quarter for your ten most visited pages. After a year you will have a clear picture of which pages open the door and which keep people in the room, and you can plan your editing around it.
Find the split in your own reports
Open your analytics and look at the new versus returning share for your blog pages over a period of a few months. Note the overall share, and then break it down by page. Pages that attract mostly new readers are your entry points, often found through search. Pages with a higher returning share serve people who already know you.
Compare channels. Search traffic is usually mostly new readers, email and direct traffic tend to be more returning, and social traffic varies. If your returning share is very low, you may not give people a reason to come back. If it is very high, you may be reaching too few new people.
Watch engagement as well. Compare time on page, pages per visit and actions for each group. If returning readers act more often, it suggests that trust builds over time, and that bringing people back is valuable. Record your findings and review them each quarter.
Write some articles for each group
Plan your calendar with both groups in mind. Entry articles answer common questions clearly and completely, aimed at people who have never heard of you. Depth articles go further: detailed comparisons, advanced techniques, case studies and original data, aimed at those who trust you already.
Label the difference in your plan, so that you do not end up with only one type. A blog with only entry articles never gives loyal readers more, and a blog with only advanced material cannot attract newcomers. A healthy mix usually has more entry content, supported by a smaller number of strong depth pieces.
Update the entry articles that bring in most newcomers. They are your shopfront. Check that facts are current, that links work and that the next step is clear. The guide to refreshing old blog posts shows how.
Bridges that turn visits into habits
A new reader who leaves without a trace is lost, however good the article. Offer a small bridge: a related article at the end, a link to the start-here page, a newsletter sign-up that explains what and how often, or a follow button for the social network where you are most active. One clear bridge beats five.
Make the bridge relevant to the article. After a guide on choosing a product, offer a comparison or a checklist. After a how-to piece, offer the next step in the series. Relevance makes the offer feel helpful, not pushy. The guide to building a newsletter from your blog posts shows one of the best bridges.
Check that the bridges work. Click them, subscribe yourself and see what arrives. Track how many readers take each bridge, and drop those that nobody uses.
Do not forget privacy when you segment readers. If you use cookies or identifiers to tell new from returning, make sure your notice and consent settings are honest and up to date. Collect only what you need, and do not try to follow individual readers around the web. The numbers you need are totals, not names.
Avoid common mistakes
Do not chase the share of returning readers as a goal in itself. A rising share can mean loyalty, but it can also mean that new traffic is falling. Look at the actual numbers of both groups, not only the percentage.
Do not treat all returning visitors as customers. Competitors, colleagues, bots and your own team may be among them. Filter internal traffic where your tool allows it, and be cautious about small samples. The guide to bot traffic in analytics explains the noise to expect.
Do not hide your best content from newcomers behind forms or deep menus. If your strongest article is hard to find, new readers will not trust you enough to return. Make your best pages easy to reach from the home page and from related articles.
How AI Blog Autopilot helps
AI Blog Autopilot publishes articles on a steady schedule, so there is always something new for returning readers, and it plans each article around a real search query for newcomers. See the pricing page for plans.
Related reading
- Building a Newsletter From Your Blog Posts
- Bringing Readers Back to Your Blog
- The Start Here Page for a Blog
The bottom line
Read the split as a rough guide, write entry and depth articles on purpose and offer one relevant bridge from every post.
KKK
How accurate is the new versus returning split?
It is approximate. Devices, cleared cookies, privacy settings and consent choices all affect it.
What is a good share of returning readers?
There is no universal figure. Watch your own trend and the absolute numbers of both groups.
What should a new reader see first?
A clear answer near the top, a trustworthy author, fast loading and a gentle next step.
How do I bring readers back?
Offer one relevant bridge, such as a related guide or a newsletter that explains what and how often.
Do returning readers convert better?
Often they act more, but check your own data by comparing actions for each group.