ENEnglish
 LTLietuviškai
 DEDeutsch
 FRFrançais
 RUРусский
 ESEspañol
 PLPolski
 ITItaliano
 UKУкраїнська
 CSČeština
 PTPortuguês
 JA日本語
JA日本語 LVLatviešu valoda
 ETEesti
 HUMagyar
 IDBahasa Indonesia
 TRTürkçe
 HIहिन्दी
 ELΕλληνικά
 ARالعربية
 THไทย
THไทย VITiếng Việt
 RORomână
 MSBahasa Melayu
 BNবাংলা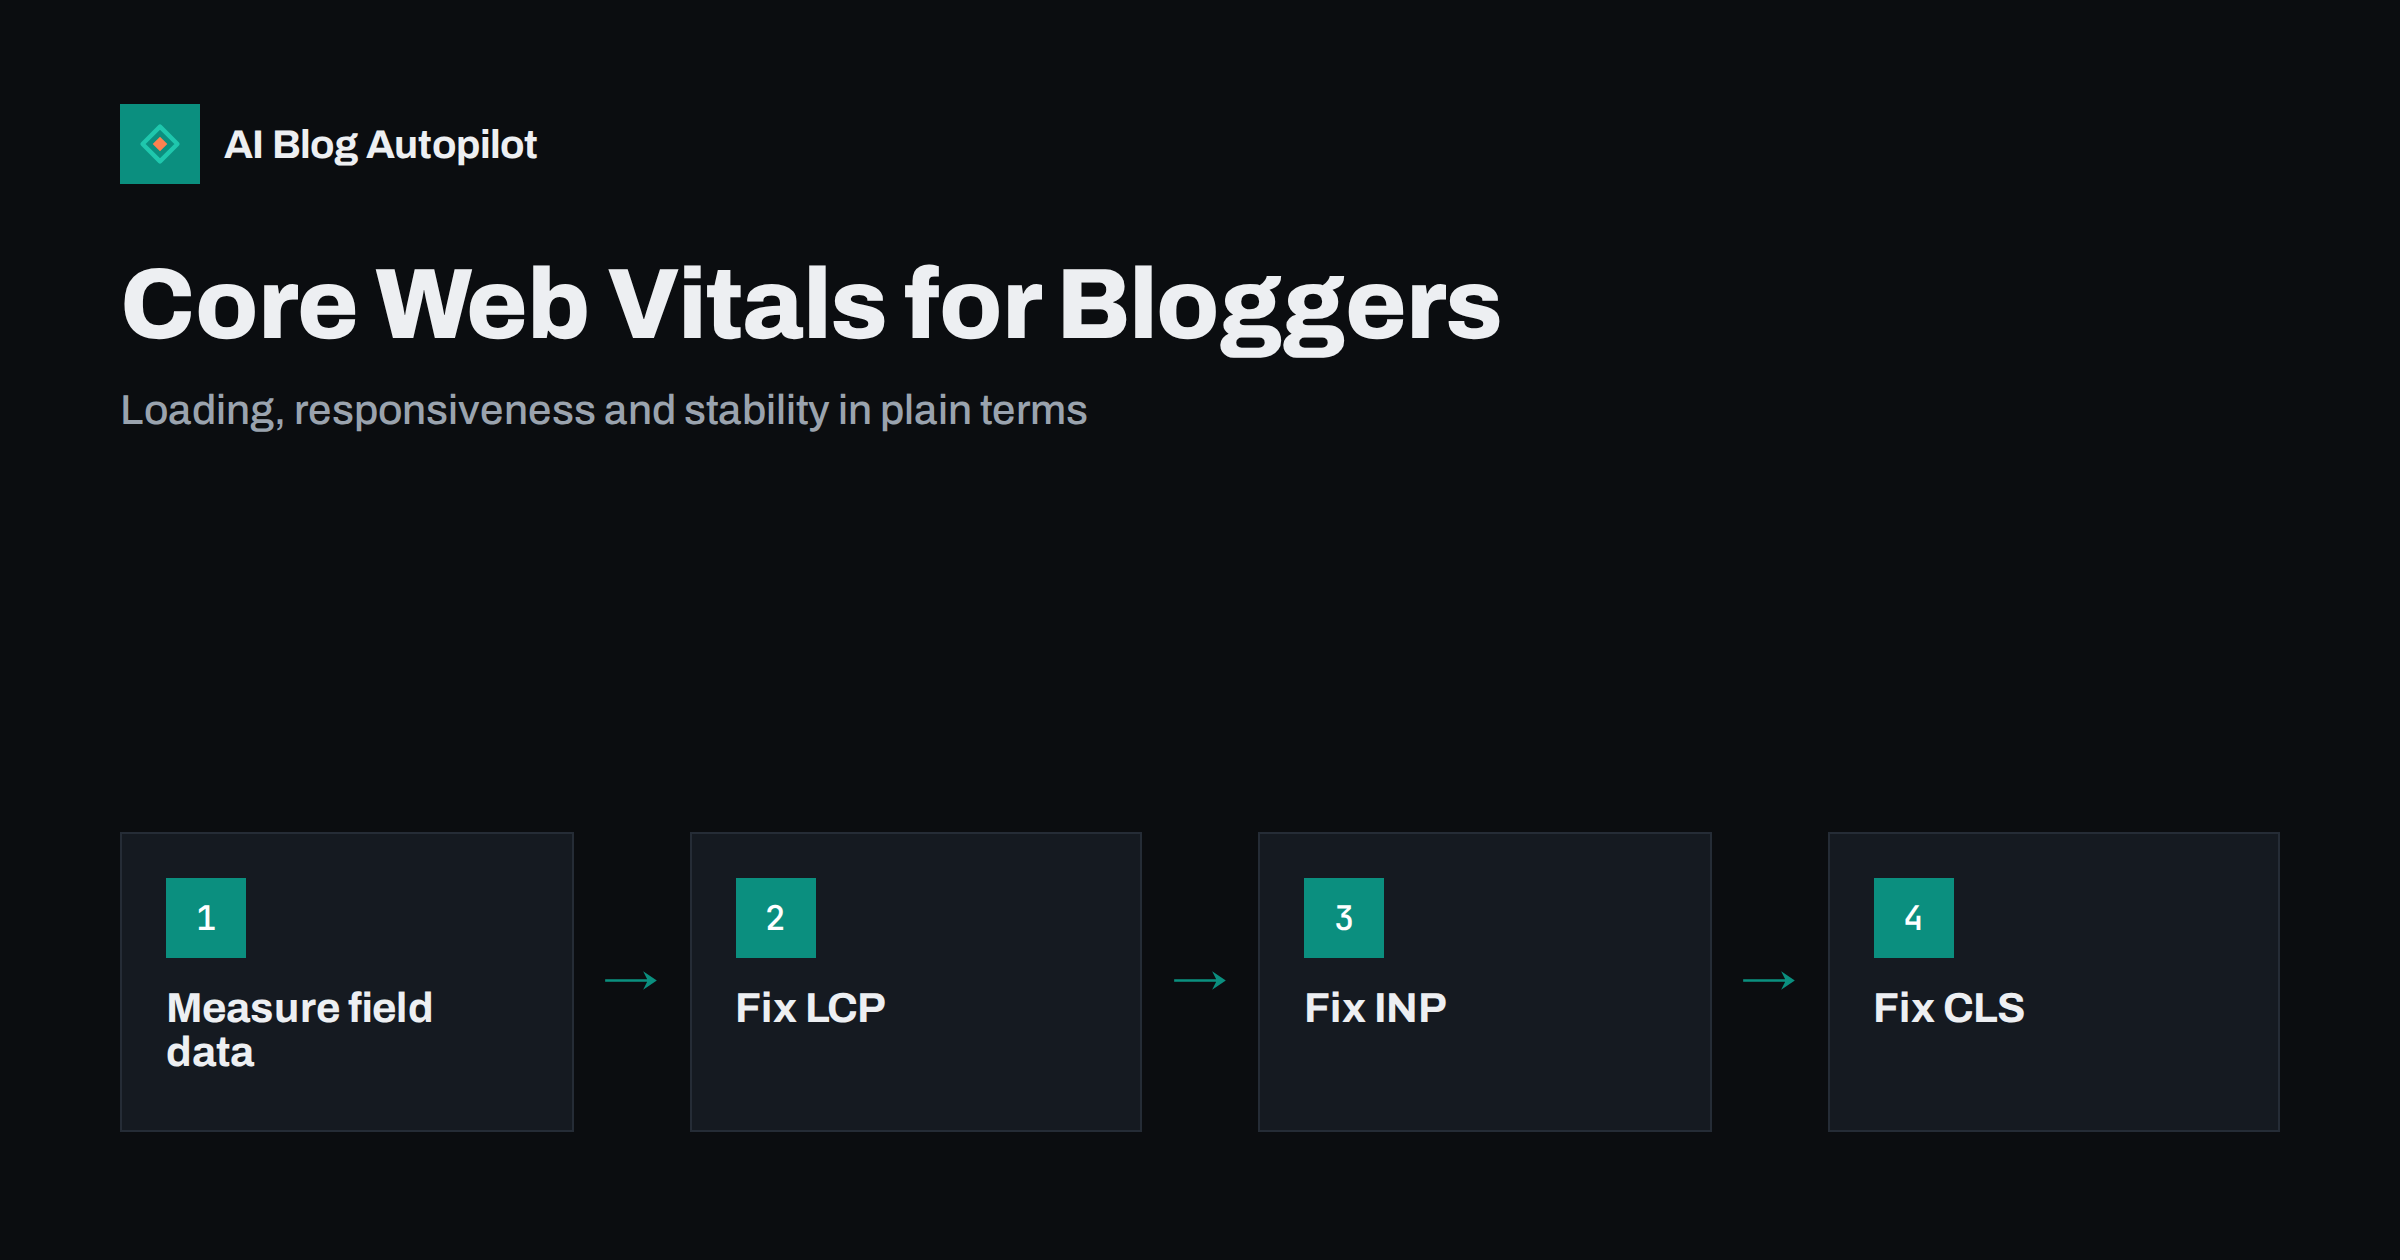
Short answer: Core Web Vitals are three measurements of real visitors’ experience: Largest Contentful Paint (LCP) for loading, Interaction to Next Paint (INP) for responsiveness and Cumulative Layout Shift (CLS) for visual stability. Good thresholds are LCP within 2.5 seconds, INP within 200 milliseconds and CLS of 0.1 or less, measured at the 75th percentile of visits. For most blogs the fixes are unglamorous: lighter images, fewer scripts and plugins, reserved space for images and ads, and decent hosting. They are a ranking signal, but a modest one next to content relevance.
Core Web Vitals are one of the few parts of SEO with clear numbers and published thresholds, which makes them both useful and easy to obsess over. A blog owner can spend weeks chasing a perfect score that changes nothing, or ignore a genuinely slow site that frustrates every reader on a phone.
This guide explains what each metric measures, how to read your own data, the typical causes on a blog, and a sensible order of fixes.
What Core Web Vitals are and why they exist
Core Web Vitals are a set of metrics defined by Google to describe how a page feels to use. Each targets a specific frustration:
- LCP: how long until the main content, usually the featured image or first large block of text, is visible.
- INP: how quickly the page responds when someone taps, clicks or types, across the whole visit.
- CLS: how much the layout jumps around while loading, such as text shifting when an image or ad appears.
INP replaced an older metric, First Input Delay, in March 2024. FID only measured the delay before the first interaction; INP considers interactions throughout the visit, which makes it stricter and more representative.
Google’s page on Web Vitals is the authoritative reference for definitions and thresholds.
The thresholds, in one table
| Metric | Measures | Good | Needs improvement | Poor |
|---|---|---|---|---|
| LCP | Loading of main content | ≤ 2.5 s | 2.5–4 s | > 4 s |
| INP | Responsiveness to input | ≤ 200 ms | 200–500 ms | > 500 ms |
| CLS | Visual stability | ≤ 0.1 | 0.1–0.25 | > 0.25 |
A page passes when at least 75 percent of visits meet the good threshold for each metric. That percentile matters: a page that is fast on your office connection can still fail if a quarter of visitors use older phones on mobile networks.
Field data versus lab data
This distinction causes more confusion than anything else about Core Web Vitals.
Field data comes from real visitors using Chrome, aggregated over the previous 28 days. It is what Search Console reports and what search ranking uses. It reflects real devices, networks and behaviour.
Lab data comes from a single simulated test, such as a Lighthouse run in your browser or in PageSpeed Insights. It is repeatable and useful for diagnosing causes, but it is one device and one connection at one moment.
Two consequences follow. First, a lab score of 60 does not mean you are failing; check the field data before worrying. Second, lab tests cannot measure INP directly, because there is no real user interacting, so they use a proxy called Total Blocking Time.
Small or new blogs may not have enough traffic for page-level field data. In that case, PageSpeed Insights shows data for the whole origin if available, and otherwise you rely on lab tests as a guide.
Where to check your own numbers
- Search Console, Core Web Vitals report. Groups your URLs into good, needs improvement and poor for mobile and desktop, based on field data. Start here to see whether there is a real problem at all.
- PageSpeed Insights. Enter any URL to see its field data (if available) at the top and a lab test with specific diagnostics below.
- Browser developer tools. The performance panel shows exactly what loads when and which scripts block interaction, useful when a fix is not obvious.
Check a representative sample: the homepage, a typical article, a long article with many images, and a category page. Blogs usually share one template, so a fix to the article template helps every post. The Search Console reports that matter covers the wider tool.
Fixing LCP on a blog
On most article pages the LCP element is the featured image at the top, or the headline and first paragraph if there is no large image. Common causes of a slow LCP, roughly in order of how often they appear:
- Oversized images. A 3,000-pixel photo displayed at 800 pixels wide. Serve appropriately sized images with srcset, which WordPress does automatically for images added through the media library.
- Old formats. WebP and AVIF are typically much smaller than JPEG or PNG at similar quality.
- Lazy loading the hero image. Lazy loading is good for images further down the page but delays the one at the top. The featured image should load immediately, ideally with a high fetch priority.
- Slow server response. If the server takes a second before sending anything, nothing else can be fast. Page caching and adequate hosting address this.
- Render-blocking CSS and fonts. Large stylesheets and several web fonts delay the first paint. Fewer font weights and a theme that loads only what it needs help.
Page speed on a content site goes further into hosting, caching and images.
Fixing INP on a blog
Poor responsiveness on a blog is usually caused by too much JavaScript running on the main thread, so the browser is busy when the reader taps something. Typical sources:
- Several analytics, tracking and advertising scripts loading together.
- Chat widgets, pop-up tools and social embeds loaded on every page.
- Page builders and plugins that add large script bundles site-wide, even where their features are not used.
- Heavy menus, sliders and animations built with scripts rather than CSS.
The fix is mostly subtraction. List every third-party script and plugin that loads on an article page and ask whether it earns its cost. Remove what is unused, delay non-essential scripts until after the page loads or until interaction, and replace heavy features with lighter alternatives. A typical content blog does not need much JavaScript at all to show an article.
Fixing CLS on a blog
Layout shift happens when something appears or changes size after surrounding content has been displayed. The usual culprits:
- Images without dimensions. If the browser does not know an image’s width and height, it cannot reserve space. WordPress adds these attributes for media library images; manually inserted or external images may lack them.
- Ads and embeds. Ad slots and embedded videos or posts that load late push content down. Reserve their space with a fixed minimum height.
- Cookie banners and notification bars inserted at the top of the page after load. Overlays that do not push content avoid the shift.
- Web fonts swapping with very different sizes from the fallback font, causing text to reflow.
CLS problems are often visible if you load a page on a phone and watch closely. If the text you started reading jumps, you have found one.
How much Core Web Vitals matter for rankings
Google has confirmed that Core Web Vitals are used in its ranking systems as part of page experience. It has also been consistent that relevance and content quality matter much more, and that a great page experience does not make up for content that does not answer the query. Google’s Core Web Vitals documentation for search states this directly.
In practice, that means:
- Moving from poor to good is worth doing, both for rankings at the margin and because slow pages lose readers.
- Moving from good to perfect is rarely worth significant effort. There is no extra credit for a lab score of 100.
- Speed work should not come at the expense of publishing and improving content.
The reader benefit is the stronger argument. People abandon slow pages, and a stable, responsive article is simply easier to read, as reading a blog on a phone shows.
A sensible order of work
- Check the Search Console report. If everything is good, stop and spend the time on content.
- If pages fail, identify which metric and which template. Most blogs have one or two templates to fix.
- Fix images first: sizes, formats, dimensions and loading priority. This often solves LCP and CLS together.
- Audit plugins and third-party scripts for INP. Remove before optimising.
- Enable page caching and consider hosting if server response is slow.
- Re-test in the lab, then wait for field data to update over the following four weeks before judging results.
That last step catches people out. Field data is a rolling 28-day window, so improvements appear gradually. Search Console’s validation feature tracks this for you.
How AI Blog Autopilot fits in
AI Blog Autopilot publishes articles to your existing WordPress site through a one-click connection, so page speed depends on your theme, plugins and hosting rather than on the tool. The articles themselves are text-based, with FAQ, tags and SEO meta, which keeps them light. Keeping your template fast means every new article benefits automatically. See how it works on the AI Blog Autopilot home page.
Related reading
- Page Speed on a Content Site: What Actually Helps
- Reading a Blog on a Phone: What to Fix First
- Featured Images for Automated Posts
The bottom line
Core Web Vitals measure loading (LCP), responsiveness (INP) and stability (CLS) for real visitors. Check the field data in Search Console first, because lab scores alone can mislead. On a blog, most problems come from oversized images, too many scripts and plugins, and elements that load without reserved space. Get from poor to good, then return your attention to content, which matters far more for rankings.
الأسئلة الشائعة
What are the three Core Web Vitals?
Largest Contentful Paint measures how quickly the main content loads, Interaction to Next Paint measures how quickly the page responds to taps and clicks, and Cumulative Layout Shift measures how much the layout moves while loading. Good values are 2.5 seconds, 200 milliseconds and 0.1 respectively.
Why is my PageSpeed score low when Search Console says my pages are good?
The score comes from a single simulated lab test on a throttled device, while Search Console uses real visitor data over 28 days. Real visitors may have faster conditions than the simulation. For rankings, the field data in Search Console is what counts.
Do Core Web Vitals affect SEO?
Yes, they are part of the page experience signals Google uses. But their influence is modest compared with relevance and content quality. Improving poor scores is worthwhile; chasing perfect scores rarely is.
What usually causes poor Core Web Vitals on WordPress blogs?
Oversized images, lazy loading of the top image, too many plugins and third-party scripts, and ads or embeds without reserved space. Slow hosting without page caching also delays everything else.
How long does it take for fixes to show in Search Console?
Field data covers the previous 28 days, so improvements appear gradually over about four weeks. Search Console’s validation feature tracks the change once you mark an issue as fixed.