ENEnglish
 LTLietuviškai
 DEDeutsch
 FRFrançais
 RUРусский
 ESEspañol
 PLPolski
 ITItaliano
 UKУкраїнська
 CSČeština
 PTPortuguês
 JA日本語
JA日本語 LVLatviešu valoda
 ETEesti
 HUMagyar
 IDBahasa Indonesia
 TRTürkçe
 HIहिन्दी
 ELΕλληνικά
 ARالعربية
 THไทย
THไทย VITiếng Việt
 RORomână
 MSBahasa Melayu
 BNবাংলা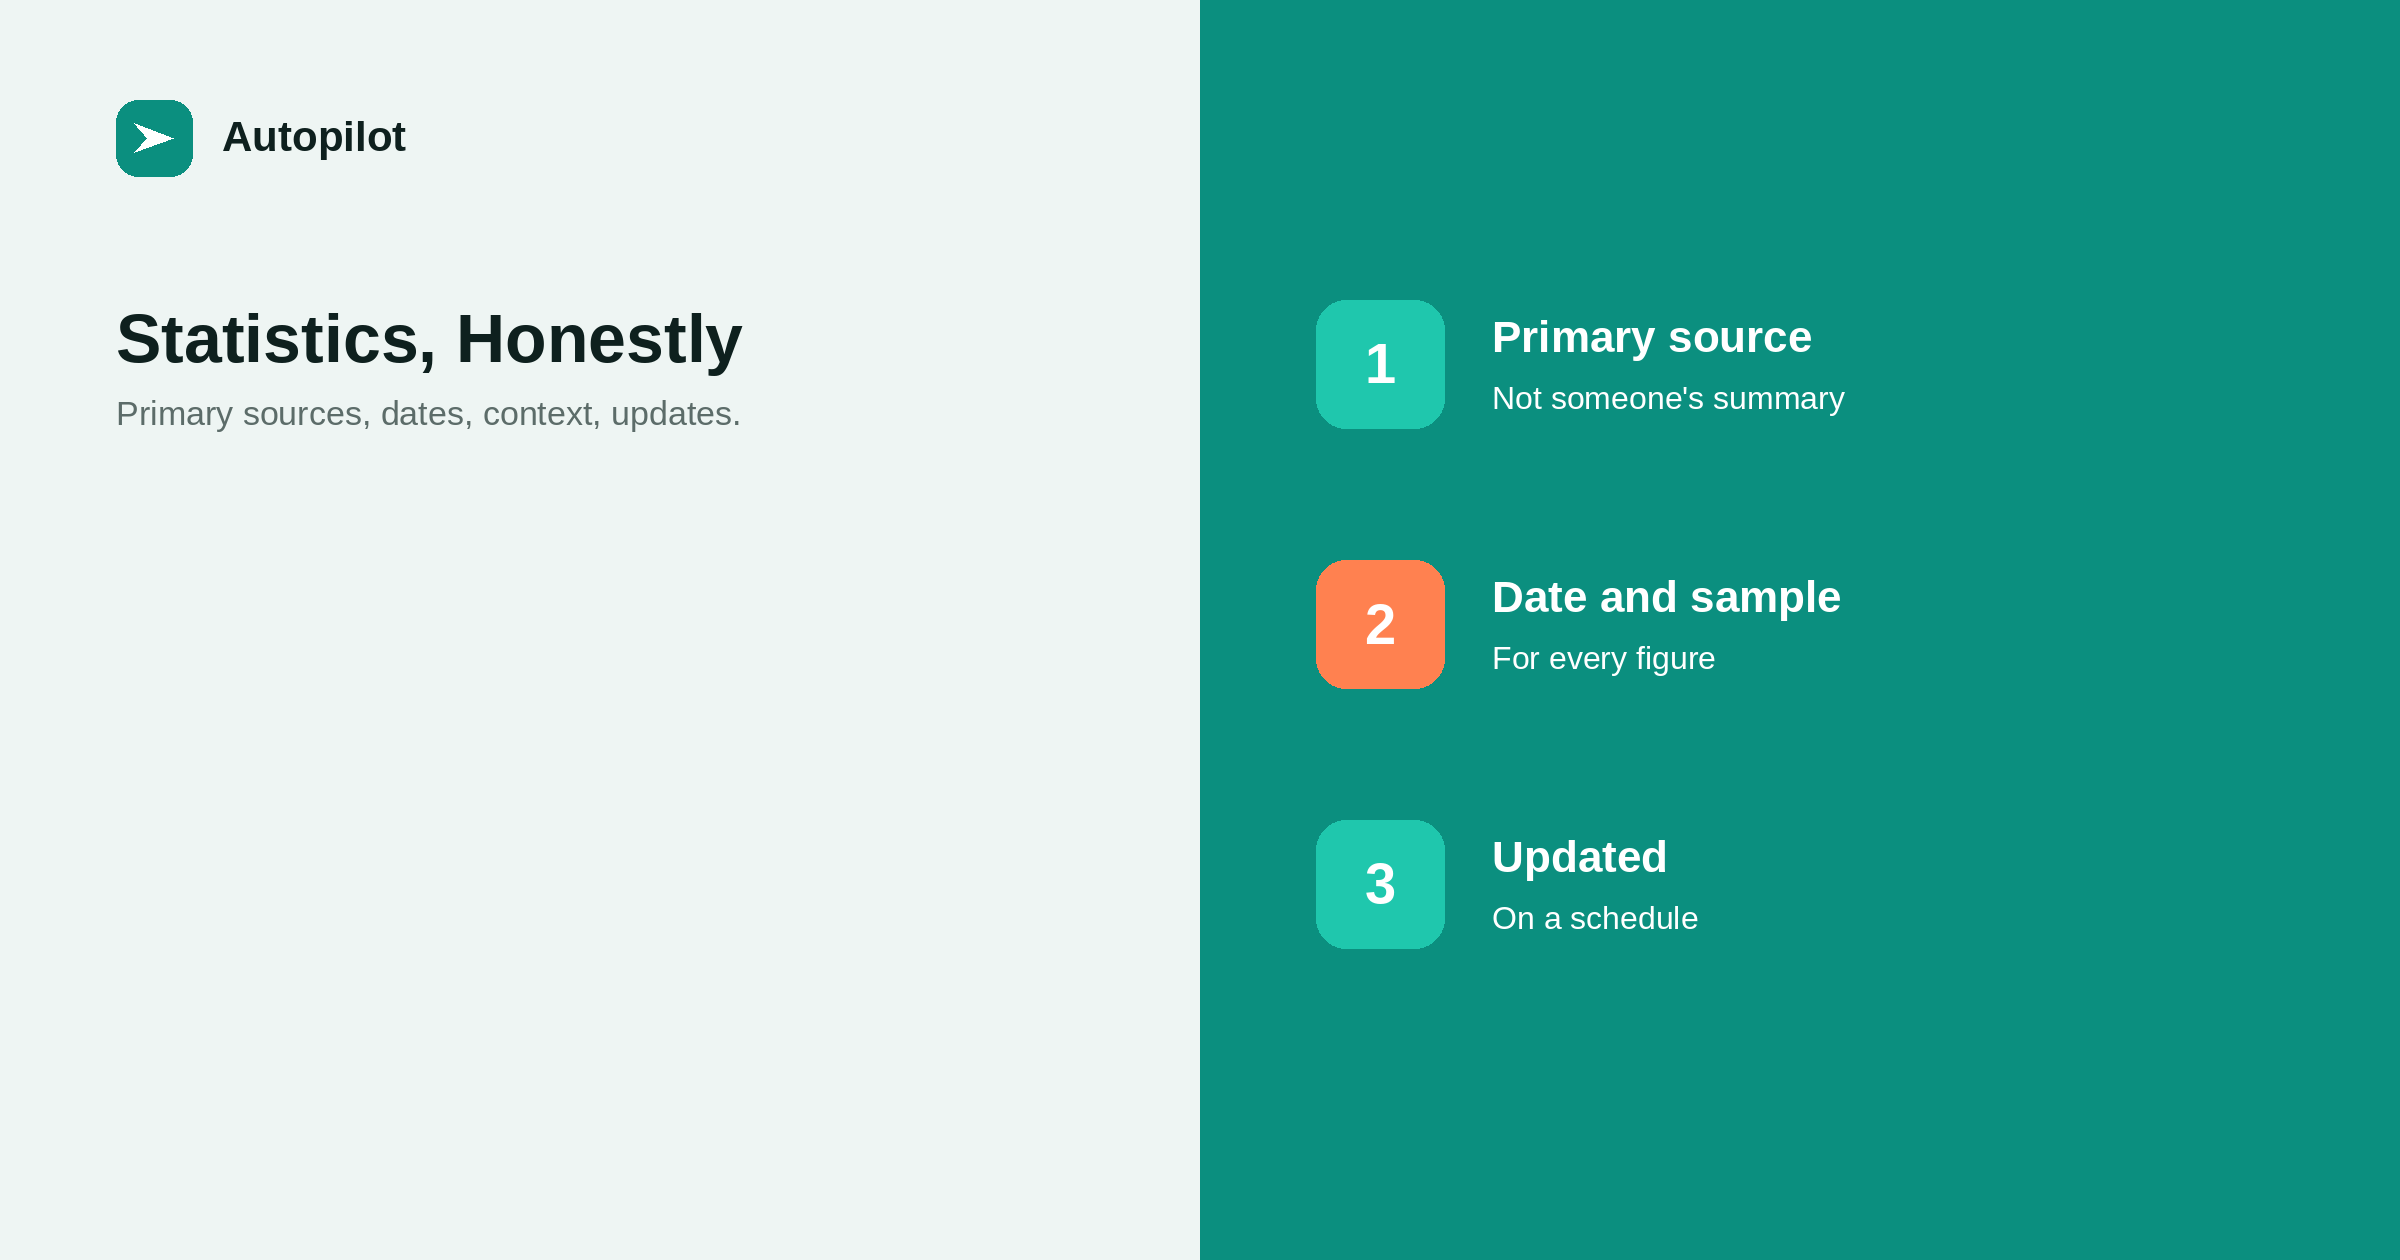
Short answer: a statistics round-up collects figures on a subject, and it is only worth publishing if every figure is traced to its primary source, dated, and described with enough context — who collected it, from whom, how many — to be understood. Drop figures you cannot trace, avoid old numbers presented as current, group statistics by the question they answer, add your own data where you have it, and review the page on a fixed schedule. Honest statistics pages are useful and linked to; careless ones spread errors.
Statistics round-ups — fifty facts about a subject — are popular because writers need numbers and link to pages that collect them. They are also a major source of misinformation: figures copied from page to page, detached from their source, date and meaning.
A carefully built statistics page is genuinely useful. It just takes more care than most receive.
Primary sources only
Every figure should link to the original: the survey report, the dataset, the official statistic. Not an article that quotes it, and not another statistics page.
If you cannot find the original, do not include the figure. Citation chains are exactly how numbers become distorted — fact-checking before you publish covers tracing them.
Date and context for every figure
Each statistic needs enough context to be understood.
| Context | Why it matters |
|---|---|
| Year collected | A 2019 figure is not a 2026 fact |
| Who collected it | Vendors may have an interest in the result |
| Who was asked | Sample and population affect meaning |
| How many | Small samples mean wide uncertainty |
| Exact wording | Paraphrase can change the meaning |
A figure without these is an assertion, not a statistic.
Group by question
A list of fifty unrelated numbers is hard to use. Group statistics by the question they answer — how many businesses do X, how much does Y cost, how has Z changed — so readers find what they need.
Add a sentence of interpretation for each group, with caveats where sources disagree.
Your own data
If your business has its own numbers, a statistics page is a natural place for them, clearly labelled with method and sample. Original data is what makes a statistics page genuinely distinctive — adding something original.
Never present figures you cannot evidence, especially about customer results.
Keep it current
Statistics pages age quickly. Review on a schedule — at least yearly — replacing outdated figures with newer ones from the same or better sources, and removing any that have no update.
Show the last-reviewed date prominently. Readers citing the page need to know how current it is.
Avoiding common errors
A few errors appear constantly.
- Figures from one country presented as global.
- Survey results from a vendor presented as neutral.
- Percentages of respondents presented as percentages of all businesses.
- Projections presented as measurements.
- Rounded or altered numbers that no longer match the source.
Automated drafts and statistics
Automated drafts are particularly prone to producing plausible statistics without sources. Never publish a statistic from a draft without finding and checking the original. For a statistics page, gather the figures by hand from primary sources and let tools help only with formatting.
Presenting the figures
Statistics are easier to use when presented consistently: the figure, a one-line description, the source with year, and a link. Tables work well for groups of comparable figures — for example, the same measure across several years or regions.
Charts can show a trend at a glance, provided they are titled with the finding and credit the source — screenshots, diagrams and charts covers making them clear. Avoid infographics that separate numbers from their sources, since they tend to be shared without context.
When sources disagree
Different studies often report different figures for the same thing, because they asked different people, in different ways, at different times. Do not pick the one that suits your argument.
Show the range, explain why the figures differ where you can, and let readers judge. Honest treatment of disagreement is one of the clearest signs that a statistics page can be trusted.
Making it easy to cite
Writers who use a statistics page need to cite the original, not you. Make that easy: a direct link to each source, and the source’s name and year written out. Many will also link to your page as the place they found it, which is a fair and common courtesy.
A short note at the top explaining how figures were selected and when the page was last reviewed adds credibility for those deciding whether to use it.
Narrow is better
A page of the fifty most useful, well-sourced statistics on a narrow subject is more valuable than two hundred loosely related numbers on a broad one. Focus on the questions your readers actually ask, and the page will be both more useful and easier to keep current.
Checking your work
Before publishing, have someone other than the compiler pick ten figures at random and trace each to its source. Any that fail the check suggest a process problem worth fixing before the page goes live. Repeat the spot check at each review.
Keep a working spreadsheet with every figure, its source URL, the date checked and the exact quotation. It makes reviews quick and settles questions when a reader challenges a number.
Removing figures
When a source is withdrawn, a study is superseded, or a figure turns out to be wrong, remove it promptly and note the change. A statistics page that quietly keeps outdated figures loses the trust it was built to earn.
Statistics in other articles
The same standards apply whenever a figure appears in any article, not only on a statistics page. A single well-sourced number in an ordinary article does more for credibility than several unsourced ones. If your statistics page is well maintained, other articles can link to its entries rather than repeating figures that will need updating in many places.
Why it is worth doing well
A careful statistics page is often linked by other writers, because it saves them the work of finding and checking sources — earning links honestly covers why that matters. It is also a public demonstration that your business handles facts carefully. Nothing guarantees links; accuracy is what makes them deserved.
Related reading
If this was useful, these cover the questions that usually come next.
- Fact-checking before you publish — verifying each figure
- Earning links honestly — why stats pages attract links
- Adding something original — publishing your own numbers
The bottom line
Trace every figure to its primary source, give its date, collector, sample and exact wording, and drop anything you cannot trace. Group statistics by question, add your own labelled data, show a last-reviewed date, review at least yearly, and never publish a statistic from a draft without checking it.
FAQ
What is a statistics round-up post?
An article collecting statistics on a subject, useful when each figure is sourced, dated and explained.
Where should statistics come from?
Primary sources: the original survey, dataset or official statistic, not articles quoting them.
How often should a statistics page be updated?
At least yearly, with a visible last-reviewed date.
What context should each statistic include?
Year, who collected it, who was asked, sample size and the exact wording.
Can I include my own company’s data?
Yes, clearly labelled with method and sample. Never include results you cannot evidence.
Can automated drafts produce statistics?
They can produce plausible but unsourced figures. Always verify against the original before publishing.