ENEnglish
 LTLietuviškai
 DEDeutsch
 FRFrançais
 RUРусский
 ESEspañol
 PLPolski
 ITItaliano
 UKУкраїнська
 CSČeština
 PTPortuguês
 JA日本語
 LVLatviešu valoda
 ETEesti
 HUMagyar
 IDBahasa Indonesia
 TRTürkçe
 HIहिन्दी
 ELΕλληνικά
 ARالعربية
 THไทย
 VITiếng Việt
 RORomână
 MSBahasa Melayu
 BNবাংলা
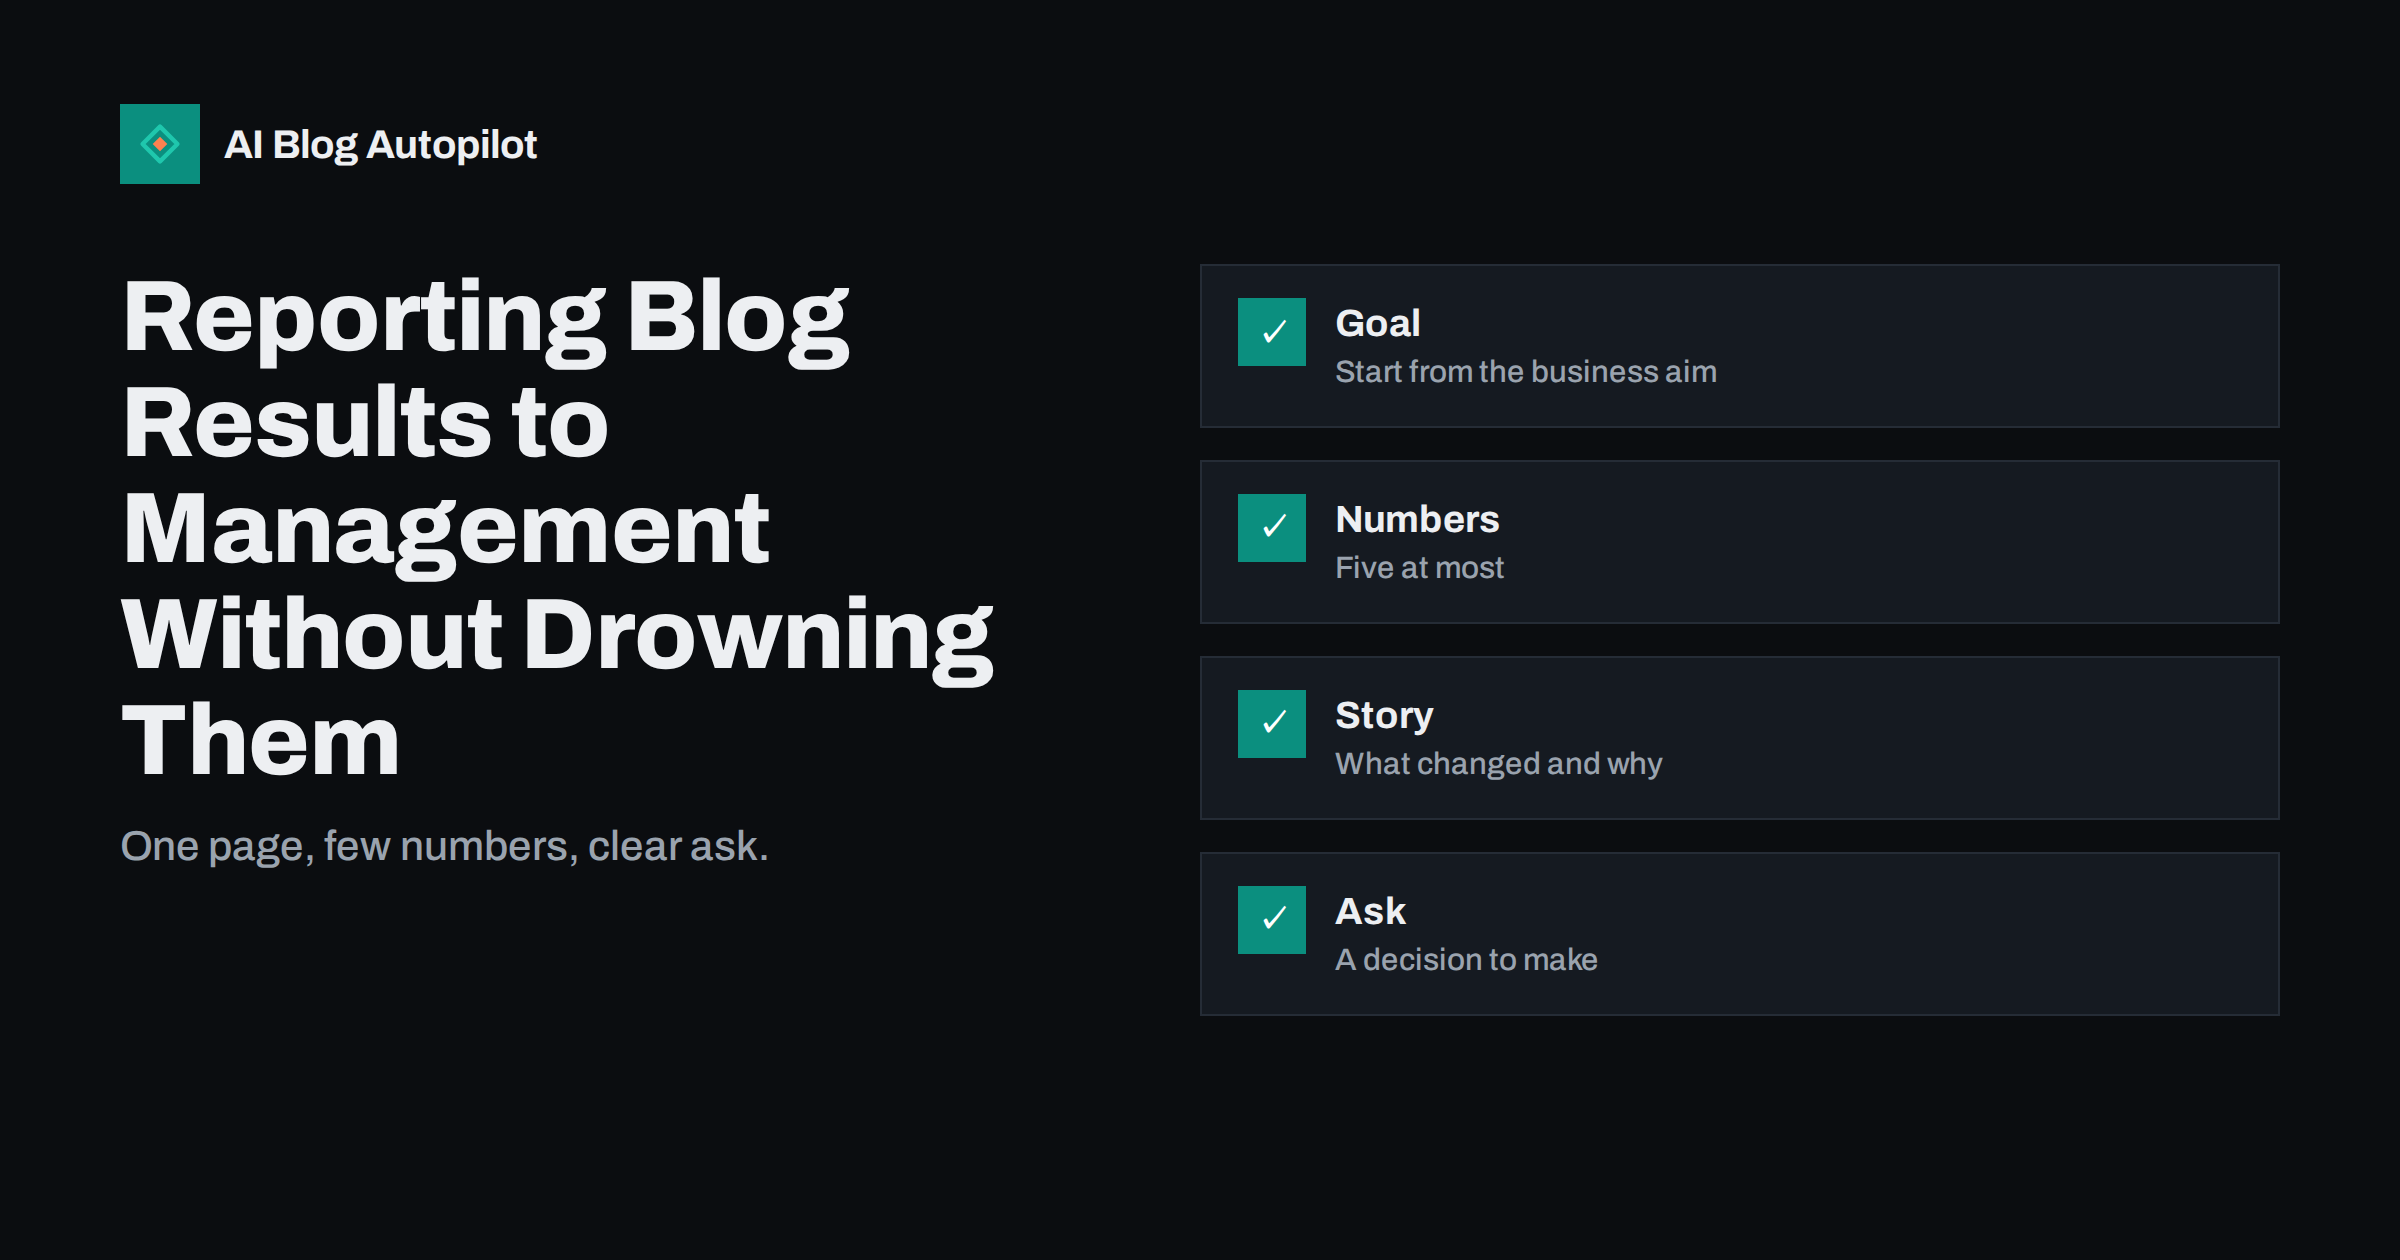
Short answer: a good blog report fits on one page, starts with the business goal, shows no more than five numbers with last month and last year beside them, explains in plain words what changed and why, and ends with a clear request for a decision. Be honest about what you cannot measure, and leave out numbers that do not change any decision.
Whoever pays for the blog will sooner or later ask whether it is worth it. A long dashboard full of charts rarely answers that question. Busy managers want to know three things: is it working, what did you do with the money and time, and what do you need from them.
This guide shows how to build a short monthly or quarterly report that managers read, trust and act on. It suits in-house marketers, freelancers reporting to clients, agencies and owners who report to themselves and want to stay honest.
Begin with what the business wants
Before you collect any numbers, write down the goal of the blog in one sentence that a manager would recognise. It might be more enquiries for a service, more sales of a product line, fewer support questions or a stronger reputation in a field. Everything in the report should connect to that sentence. If a number does not, it is a distraction.
Agree the goal with the person who reads the report. A short conversation at the start of the year prevents arguments later. If the manager thinks the blog exists to bring sales and you report traffic, both of you will be disappointed. If the goal changes, update the sentence at the top of the report so everyone sees it.
Different readers care about different things. A finance director wants cost and return, a sales lead wants leads and conversations, a founder wants reputation and growth. If you report to several people, keep one core page and add a short note for each reader, instead of producing several reports.
Choose five numbers and no more
Pick a small set of measures that follow the goal. For a blog that supports sales, you might choose organic visits, enquiries that start on blog pages, enquiries that mention the blog, articles published and a cost figure. For a blog that reduces support load, you might track visits to help articles and the number of tickets on the same topics.
Show each number with last month, the same month last year where you have it, and a simple note on direction. A number without context means little: ten thousand visits might be growth for one blog and decline for another. Comparison gives the number meaning.
Resist the urge to add more. Every extra number competes for attention and invites questions about things that do not matter. Keep a longer appendix for those who want details, and make the first page strong enough to stand alone. The guide to measuring whether a blog is working covers the choice of measures in more depth.
Explain the story in plain words
Numbers alone invite guesses. Under the table, write three or four sentences that say what happened, why you think it happened and what you did or will do about it. For example: visits fell after a seasonal peak as expected, two guides now rank on the first page for their topics, and enquiries from blog pages doubled because we added a clear contact box.
Use everyday language. Words such as impressions, sessions and attribution mean something to you but little to many managers. Say how many people visited, how many contacted you and where they came from. If you need a technical term, explain it once.
Be honest about causes. If you do not know why a number moved, say so, and say how you plan to find out. Managers trust a report that admits uncertainty far more than one that invents a neat explanation and is later proven wrong.
Show what the blog cost and what it did
Include a simple cost figure: money spent on tools, writers, images and promotion, plus the time involved if it matters to the reader. A report that ignores cost cannot answer whether the blog is worth it. Keep the arithmetic simple, and explain what is included. The article on what a blog actually costs per month can help you list the items.
Next to cost, show outcomes in the units the business understands: enquiries, orders, sign-ups or resolved questions. If you can estimate value, such as the average value of an enquiry, state your assumption and give a range instead of a single figure. A modest, honest estimate is easier to defend than a large, uncertain one.
Include work done as well as results. List the articles published, the older ones updated and the technical fixes completed. Results lag behind effort, so showing the work reminds readers that the blog is an investment that takes months to mature.
Be honest about what you cannot measure
Some benefits are real but hard to count: readers who call without mentioning the blog, buyers who read three articles and return by typing your name, journalists who find you through a guide. Say so in a short line, and describe how you partly track them, such as asking new customers how they found you.
Do not hide bad news. If traffic dropped, say it first, with the reason and the plan. A manager who finds out from another source will wonder what else is missing. Early honesty lets you ask for help while it still matters.
Avoid vanity measures that look impressive but change nothing, such as total followers, page views of the home page or the number of keywords tracked. If you include them for context, label them clearly as context and do not build the story around them.
End with a clear ask
A report that only informs is easy to forget. End with one to three requests: approve a budget for a new series, give access to a subject expert for interviews, allow time to update old guides, or agree to stop a topic that is not working. Make each request specific and say what the benefit will be.
Offer a decision, not a discussion. For example: we propose to spend the next quarter on three comparison guides, which should bring more enquiries from people choosing between options; please confirm by the fifteenth. A date and a clear option make it easy to say yes, or to say no with a reason.
Record decisions in the next report. When you say that last month’s request was approved and this is what happened, you build a record that shows the value of the blog and of your judgement.
Share the report in the format the reader prefers. Some like an email with the page pasted in, some like a document in a shared folder and some prefer five minutes in a meeting. Ask once and keep to it. A report that is delivered in the wrong way may not be read at all.
Keep a rhythm and a template
Use the same layout every month. A template saves time and lets readers find the numbers in the same place. Keep a copy of each report in a shared folder, so that trends are visible and a new person can see the history. Update it on a fixed day, such as the first working week of the month, to avoid a last-minute scramble.
Automate the collection of numbers where you can, but write the story yourself. A dashboard can gather data, but explaining what it means is your job. Spend the time saved by automation on thinking about causes and next steps.
Review the template every quarter. Remove numbers nobody has used, add one if a new question keeps coming up, and ask the reader what they find useful. A report improves when it is treated as a product with a customer.
Keep a short list of the lessons from each quarter, such as which formats worked, which topics did not and which assumptions were wrong. Showing what you learned, not only what you achieved, reassures managers that money is being spent thoughtfully, and it makes next quarter’s plan easier to explain.
If the blog serves several teams, offer each of them a short slot in the plan. Sales may want comparison guides, support may want help articles and the founder may want opinion pieces. Showing how requests are weighed makes priorities visible and prevents quiet resentment.
Handle questions and pushback
Expect questions, and prepare for the common ones. Why did traffic fall? Why are we writing about this topic? What would happen if we stopped? Keep short notes on each, with the evidence you hold. If you cannot answer, say you will find out and give a date. A calm, prepared answer protects the blog’s budget better than an impressive chart.
Some managers distrust content because they have seen blogs produce nothing. Show the specific link between an article and an outcome wherever you can: this guide ranks for a question customers ask, and the contact box beneath it produced a number of enquiries. One clear example is more convincing than a page of averages.
When a manager proposes a change, such as a new topic or a different tone, treat it as an experiment. Agree what you will measure, for how long, and what result would count as success. This turns opinions into tests and keeps the discussion friendly.
Finally, thank the people who helped. Subject experts, designers and customer service colleagues all contribute to a good blog, and a line of credit in the report makes them more willing to help again.
How AI Blog Autopilot helps
AI Blog Autopilot publishes articles on a schedule and shows a calendar of what went out, which makes the work-done section of your report easy to fill in. See the pricing page for plans and monthly credits.
Related reading
- How to Measure Whether a Blog Is Working
- A Monthly Blog Review Agenda
- Traffic or Leads: Which Number Should a Blog Chase?
The bottom line
One page, five numbers with context, an honest story, a cost figure and a clear request will do more than a long dashboard.
FAQ
How long should a blog report be?
One page for the main report, with a longer appendix only for readers who want the detail.
How many metrics should I include?
No more than five, each with last month and the same month last year where available.
What if the numbers are bad this month?
Say so first, give the likely reason and propose a plan. Honest early news builds trust.
How do I show value from hard-to-measure benefits?
Name them in a short line and describe how you partly track them, for example by asking new customers how they found you.
How often should I report?
Monthly for the working report and quarterly for decisions about budget and direction.