ENEnglish
 LTLietuviškai
 DEDeutsch
 FRFrançais
 RUРусский
 ESEspañol
 PLPolski
 ITItaliano
 UKУкраїнська
 CSČeština
 PTPortuguês
 JA日本語
JA日本語 LVLatviešu valoda
 ETEesti
 HUMagyar
 IDBahasa Indonesia
 TRTürkçe
 HIहिन्दी
 ELΕλληνικά
 ARالعربية
 THไทย
THไทย VITiếng Việt
 RORomână
 MSBahasa Melayu
 BNবাংলা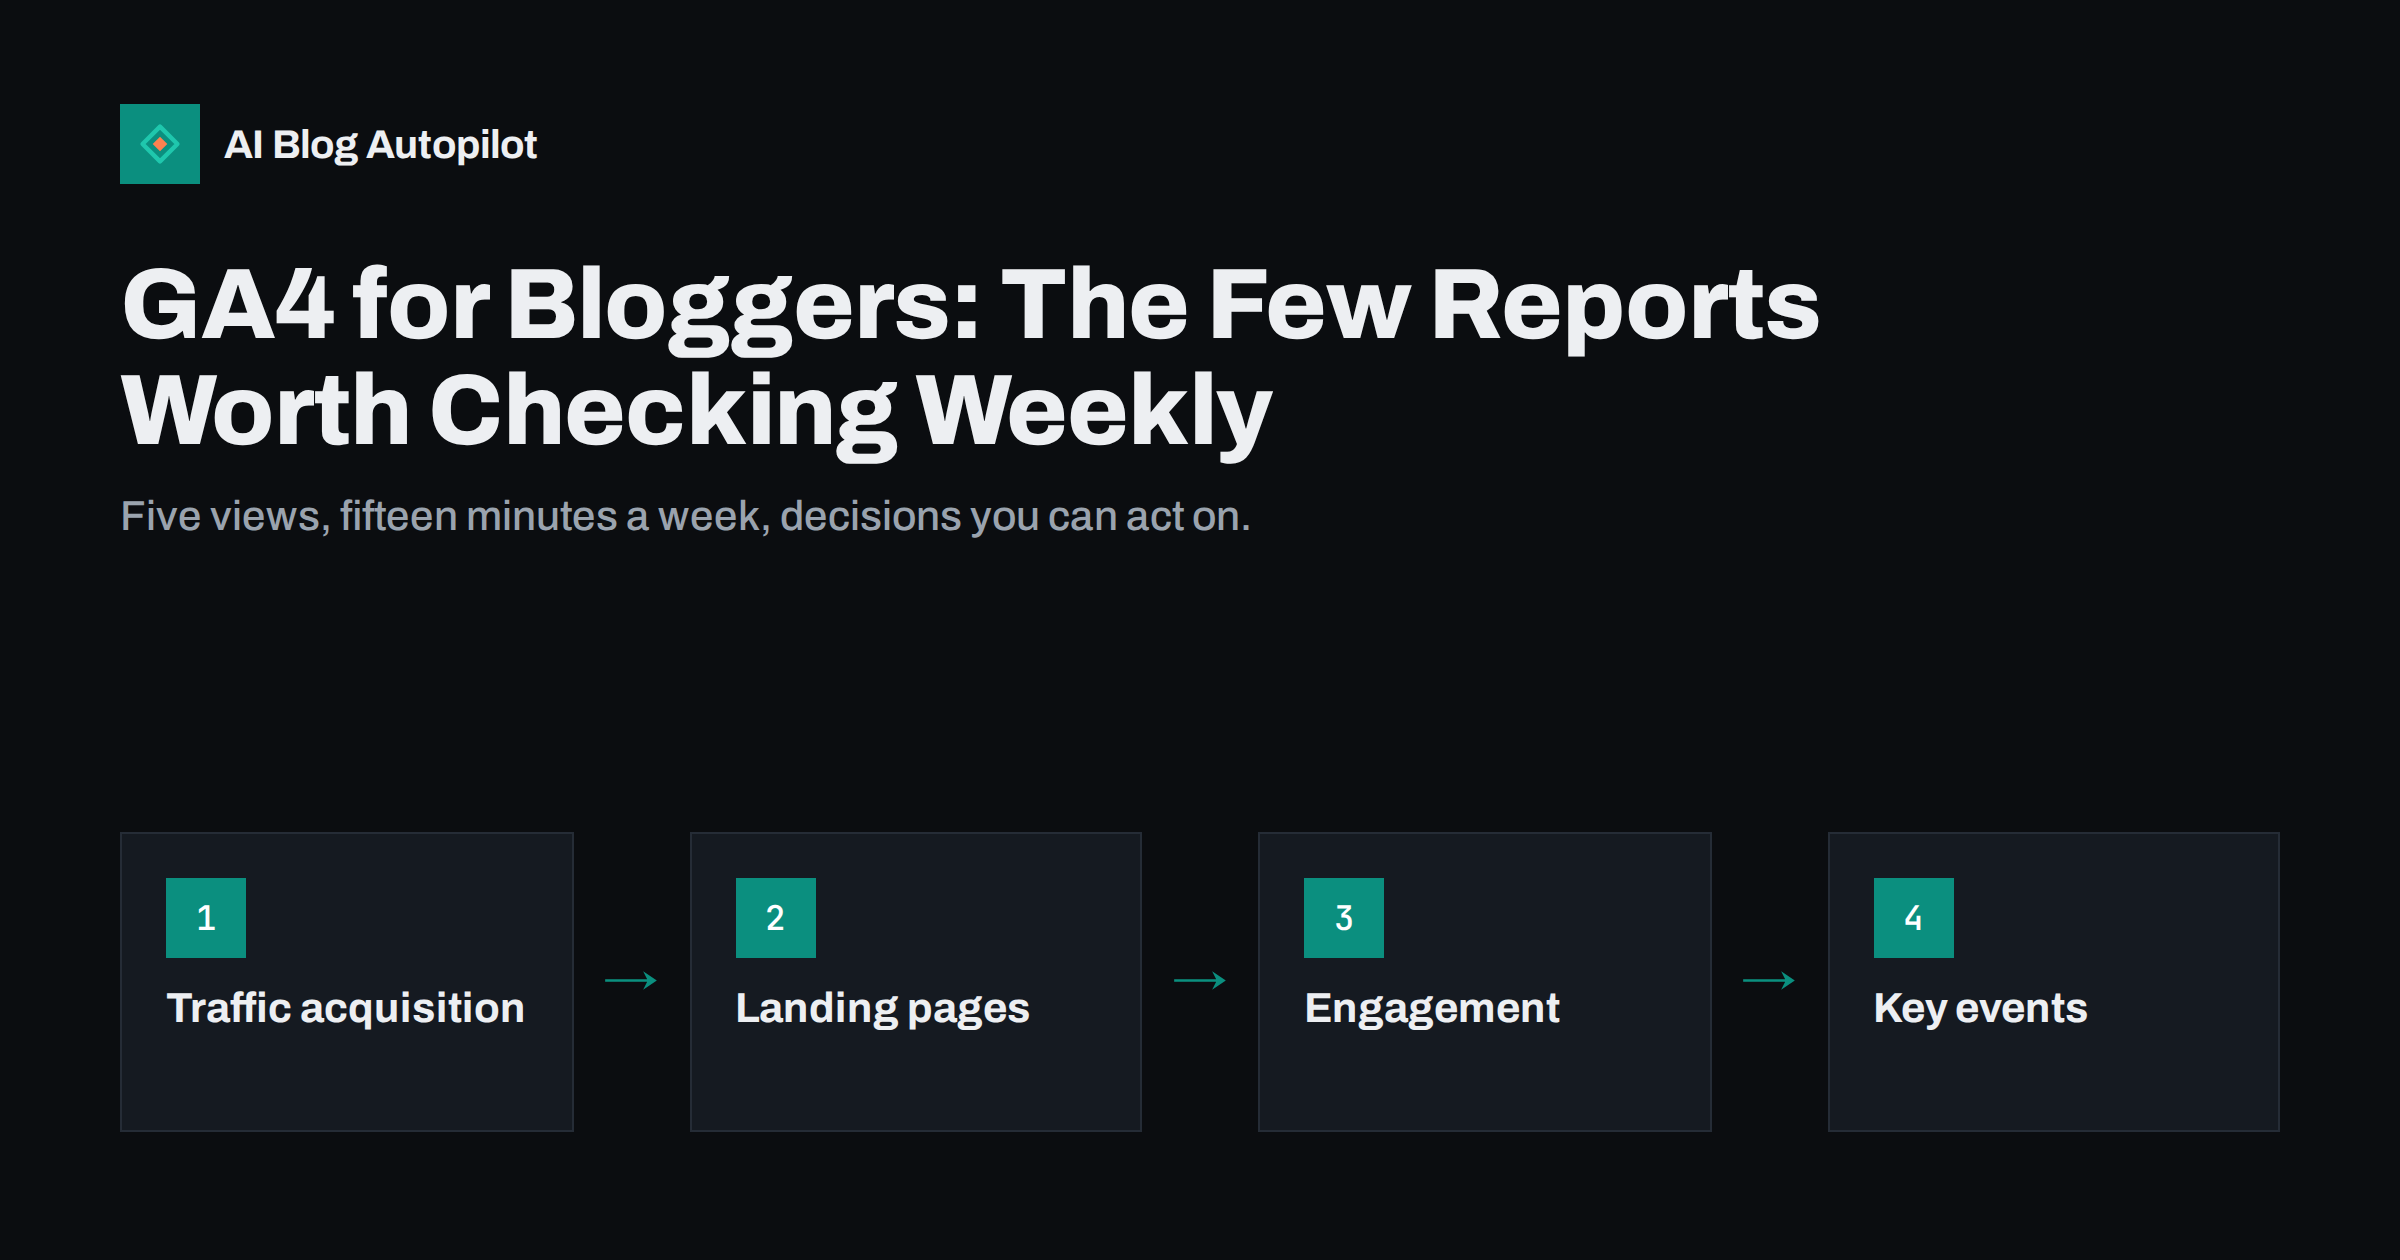
Short answer: most bloggers need only a handful of Google Analytics 4 views: traffic acquisition to see where readers come from, the landing page report to see which articles start visits, engagement metrics to see whether people read, key events to see whether visits lead to sign-ups or enquiries, and the Search Console integration for search queries. Check them weekly for trends, compare against the previous period, and ignore the rest until you have a specific question.
Google Analytics 4 can feel overwhelming. The interface is full of reports, dimensions and exploration templates, and many bloggers either stop opening it or spend an hour every week clicking around without learning anything they can act on. The good news is that a blog has simple questions: are more people finding my articles, which ones, from where, and do those visits do anything useful? This guide shows the small set of reports that answer those questions, and how to read them without fooling yourself.
Start with the questions, not the reports
Before opening GA4, write down what you actually want to know. For most blogs, it comes down to five questions:
- Is total traffic growing, flat or falling compared with last month and last year?
- Which channels bring readers: search, social, email, referrals or direct?
- Which articles bring new visitors in?
- Do visitors engage with the content, or leave immediately?
- Do visits lead to anything that matters, such as a newsletter sign-up, an enquiry or a product page view?
Each of the reports below answers one of these questions. If a report does not help with any of them, you can skip it.
It also helps to agree on one main metric for the blog as a whole. For a hobby blog it might be engaged sessions; for a business blog it is usually key events such as enquiries or sign-ups that started on an article. Having one number to watch keeps the weekly review short and stops you from optimising for whatever metric happened to move that day.
Report 1: Traffic acquisition
The traffic acquisition report, found among the acquisition reports, groups sessions by channel such as Organic Search, Organic Social, Direct, Referral and Email. This is your first stop each week.
What to look at:
- Trend per channel. Use the date comparison to compare the last 28 days with the previous period, and with the same period last year if you have the data. Seasonal blogs especially need the year-on-year view.
- Share of organic search. For most content blogs, search is the largest channel over time. A sudden drop here deserves a closer look in Search Console.
- Social and email. These show whether your distribution efforts are working. If you tag links with UTM parameters, you can break them down by source and campaign.
Be careful with “Direct”. It includes visits where the source could not be identified, such as some app traffic, links in documents and some privacy-focused browsers. A growing Direct share does not always mean more people are typing your address.
Report 2: Landing pages
The landing page report, in the engagement section, shows which pages started sessions. For a blog this is often more useful than the general pages report, because it tells you which articles bring people in rather than which pages are viewed once people are already on the site.
Use it to:
- Find your top entry articles and make sure they are up to date and link to related content.
- Spot articles whose landing sessions are falling over several months, a sign of content decay.
- See which new articles have started to attract visits after publication.
Add a secondary dimension for session source or channel to see whether an article’s visitors come mainly from search, social or elsewhere. An article that only performs on social may need better search targeting, and the reverse is also useful to know.
Report 3: Engagement metrics
GA4 measures engagement differently from older analytics tools. An engaged session is one that lasts longer than ten seconds, includes a key event, or includes at least two page or screen views. The engagement rate is the share of sessions that were engaged, and bounce rate in GA4 is simply the opposite: the share of sessions that were not engaged.
For a blog, the useful engagement numbers are:
- Engagement rate per landing page. Compare articles of similar type. A guide with a much lower rate than its neighbours may have a slow page, a misleading title, or an introduction that does not answer the question.
- Average engagement time. This counts time while the page is in focus, so it is a reasonable proxy for reading. Long guides should show longer times than short news posts.
- Views per session. Low numbers are normal for blogs, but if they are very low everywhere, internal links and related-post sections may need work.
Do not chase a universal “good” engagement rate. It depends on content type, traffic source and device. Compare your own articles with each other and with their own past performance.
Report 4: Key events
Key events, previously called conversions in GA4, are the actions you mark as important. A blog without key events can tell you how many people read, but not whether the blog helps the business.
Useful key events for a blog include:
- Newsletter sign-up completed.
- Contact or quote form submitted.
- Click to a product, pricing or booking page.
- Download of a lead magnet such as a checklist.
Set up only a few, mark them as key events, and then view them by landing page. That shows which articles start visits that end in an action, which is often a very different list from the most-visited articles.
Keep in mind that blog readers rarely act on their first visit. Someone may read three articles over two weeks before signing up. GA4 attribution settings decide how credit is shared between those visits, so treat article-level key event numbers as a guide to which content supports actions, not as an exact measure of what each article earned.
Report 5: Search Console data inside GA4
GA4 can link to Google Search Console. Once linked, and once the Search Console reports are published in your report library, you can see search queries and organic landing pages with impressions, clicks, click-through rate and average position alongside GA4 engagement data.
This is useful for spotting articles with many impressions but few clicks, which often need a better title or description, and for seeing which queries bring engaged readers. For deeper query analysis, Search Console itself is still the better tool, because it keeps more history and offers more filtering.
If you manage several sites, link each GA4 property to its matching Search Console property, and check after any domain or protocol change that the link still points to the right one.
A 15-minute weekly routine
- Open traffic acquisition, compare the last 28 days with the previous period, and note any channel that moved by more than you would expect.
- Open the landing page report, sort by sessions, and check the top 20 articles for big changes.
- Look at engagement rate for new articles published in the last month.
- Check key events by landing page and note the articles that drive actions.
- Write down one or two actions: refresh an article, improve a title, add internal links, or plan a related post.
Monthly, repeat the same steps with year-on-year comparison and review whether your list of key events still reflects what the business needs.
Common GA4 mistakes on blogs
- Comparing GA4 and Search Console numbers directly. They measure different things: sessions on your site versus clicks in search results. They will never match exactly.
- Reacting to daily swings. Single days are noisy. Look at weekly or 28-day trends.
- Counting your own visits. Filter internal traffic so your own editing sessions do not inflate the numbers.
- Short data retention. GA4 keeps detailed data for explorations for a limited period that you set in the admin settings. Check the setting early so you do not lose history you need for comparisons.
- Ignoring consent effects. Where visitors must consent to analytics, some sessions are not recorded. Treat GA4 as a trend tool, not an exact count.
- No UTM tags on social and email links. Without them, much of this traffic is harder to attribute correctly.
How AI Blog Autopilot helps
AI Blog Autopilot plans, writes and publishes SEO articles on your WordPress blog and shares every article to your social networks, with blog and network timing handled automatically. A steady publishing pace makes your GA4 trends easier to read, because changes are not hidden by long gaps between posts. Its content map also shows where each article and social post went, which complements what GA4 tells you about the visits they bring. More details are on the AI Blog Autopilot homepage.
Related reading
- Search Console vs Analytics: Why the Numbers Never Match
- Tracking Visits From AI Assistants in Your Analytics
- How to Measure Whether a Blog Is Working
- UTM Tags for Social Shares: Tracking Which Posts Bring Readers
The bottom line
You do not need to master GA4 to run a blog well. Five views answer the questions that matter: traffic acquisition, landing pages, engagement, key events and Search Console data. Check them weekly for trends, compare periods instead of reacting to single days, and finish each session with one concrete action for your content.
FAQ
What is a good engagement rate for a blog in GA4?
There is no universal benchmark, because it depends on content type, traffic source and device. Compare your articles with each other and with their own past performance. A noticeably lower rate on one article is a signal to check its speed, title and introduction.
Why do GA4 and Search Console show different numbers?
Search Console counts clicks from Google search results, while GA4 counts sessions recorded on your site. Consent settings, blocked scripts, time zones and attribution rules all cause differences. Use each tool for trends rather than expecting exact matches.
What are key events in GA4?
Key events are actions you mark as important, such as a newsletter sign-up or a contact form submission. They were previously called conversions in GA4. Viewing them by landing page shows which articles lead to useful actions.
How often should a blogger check Google Analytics?
Once a week is enough for most blogs, with a slightly longer monthly review that includes year-on-year comparison. Daily checks mostly show noise. The goal is to spot trends and turn them into content actions.
Is bounce rate still used in GA4?
Yes, but it is defined differently than in older analytics. In GA4, bounce rate is the share of sessions that were not engaged, meaning shorter than ten seconds, with no key event and only one page view. It is the inverse of engagement rate.